The Bullish Engulfing Pattern Candlestick
The bullish engulfing pattern is a reversal pattern compromising of two candlesticks. The pattern helps traders to open long positions and it usually occurs at the bottom of a downtrend. Engulf in literal terms refers to sweep or cover something in a way that it hides completely. Hence, the bullish engulfing candle pattern signals exhausting bears and potential takeover of the market by strong buyers.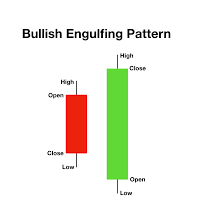
The pattern’s come into formation when a large bullish candle takeover the black or small bearish candlestick engulfing its whole body. It shows that the market is ready to push the price to higher highs with fewer people willing to sell the commodity. The bullish engulfing trading strategy works best in the daily chart, although a small price rise usually occurs on the lower timeframe.
Keynotes on the bullish engulfing pattern
- A bullish engulfing indicator is a visual formation and signals a reversal in the market.
- The bullish engulfing candlestick has a low success rate but works great in combination with oscillators.
- The indicator works well when the price has been in a constant downtrend in previous candles.
- The pattern is a reversal of the bearish engulfing pattern, which signals exhausting bulls.
The formation of bullish engulfing candle pattern
The bullish engulfing candlestick formation is not a simple white or green candlestick on Forex or Crypto chart. The formation of previous black candles and its engulfing signals increasing buying activity and rise of volume. The bullish engulfing candlestick is easy to spot and is one of the favorite patterns for new traders.
It comes into formation after price makes a new low or is in a consolidation process. The body of the first candle can be large or small depending on price movement. On the second day, the candlestick must open or trade below the previous lows, but its body should stretch to newer daily highs during the daily trade. In other words, the second candle should cover the main body of the previous bearish candle. Besides, it should also be a green or white candle to complete bullish engulfing the pattern.
Formation in Practice
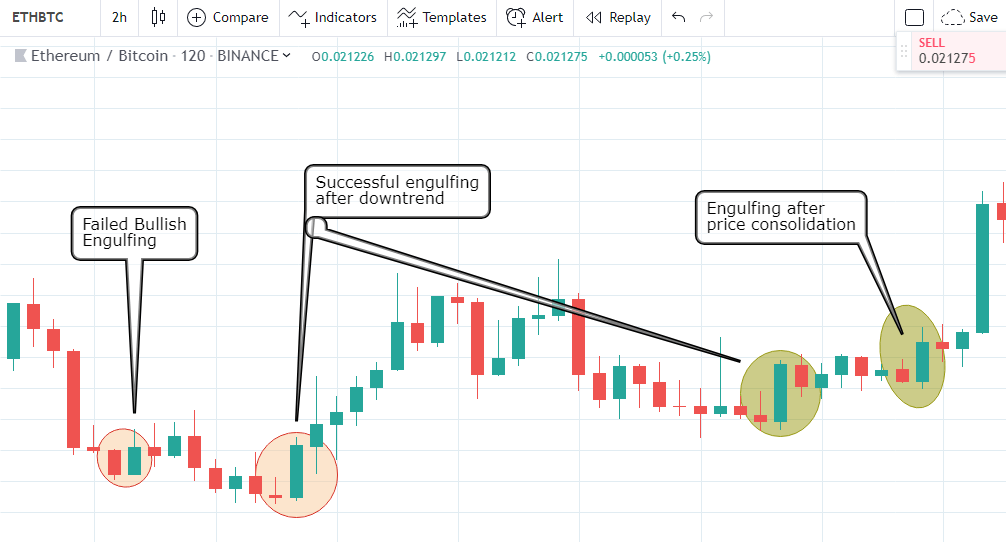
Bullish engulfing pattern is easy to spot. However, its success rate is not as high as the cup and handles candlestick formation. Below is a chart of ETHBTC depicting several bullish engulfing candle pattern. From the image below we can conclude that this indicator is a common occurrence on forex or Crypto charts.
Engulfing candle trading strategy
There are times when a trader might buy a stock or Cryptocurrency using the bullish engulfing candle pattern. However, many buyers use this candlestick pattern along with several indicators to determine a more meaningful picture. The stock or Cryptocurrency traders usually step-in to the market after analyzing the volume and Relative Strength Index (RSI) of the commodity.
Similarly, many traders also wait for the consecutive candle formation before executing their trade. Doing this, the trader confirms that a reversal is trying to confirm and a price leg-up is likely expected.
In Conclusion
The bullish engulfing candle pattern is a powerful indicator when used in conjunction with oscillators, such as Exponential Moving Averages (EMA). They show a shift in a downtrend but their common formation on charts diminish its reliability.
Considering the volatility in Cryptocurrencies, the engulfing candle might be huge sending the asset in the oversold territory along with a large stop loss. Moreover, the bullish engulfing pattern doesn’t provide a price target for traders when opening a long trade. Hence, solely using this candlestick pattern doesn’t seem to be a great option.

