The Guide to Bearish Engulfing Candle Pattern
The bearish engulfing candle is a reversal pattern and usually occurs at the top of an uptrend. It signals an upcoming bearish movement and compromises two candlesticks to complete the formation. The bearish engulfing pattern is one of the favorite visuals for new and pro traders to make short-term gains or exit the market.
The engulfing candle indicator occurs when a large bearish candle engulfs the full body of the previous candle. The previous candle should be green and must appear in an uptrend. The bearish engulfing candle formation is important for traders as it alerts the traders for an incoming bear market and is a good entry for a short call.
Keynotes on the Bearish Engulfing Candle
- A bearish engulfing pattern can take place anywhere on the stock or Bitcoin chart. However, it has a higher success rate if the engulfing candle indicator comes into the formation during a price uptrend.
- The body of the second candle in the bearish engulfing indicator must be red and should be bigger than the previous one. It should also engulf the whole body of the previous candle to complete the formation.
- The bearish engulfing is the opposite of the bullish engulfing pattern
- The bearish candle formation doesn’t have a high success rate when comparing it to other similar indicators such as Head and Shoulder pattern.
The Formation of Bearish Engulfing Pattern
The bearish engulfing pattern is not a simple combination of green and red candles on forex or Bitcoin charts. At times they can signal strong reversal formation and provide a good entry or exit points. It comes into formation after price makes newer highs and is a very easy indicator to spot. The buyers of the stock or Crypto push the price to a point where bulls get exhausted and lose the momentum.
Hence the first candle must be green with a proper body and must not be a Doji candle. The second candle in the pattern is long and bearish. The bearish engulfing indicator has a high success rate if the body of the second candle trade below the lows of the previous candle and also stretches to newer highs. The candle pictures increasing bears and bullish activity and usually contains a higher volume than later.
Formation in Practice
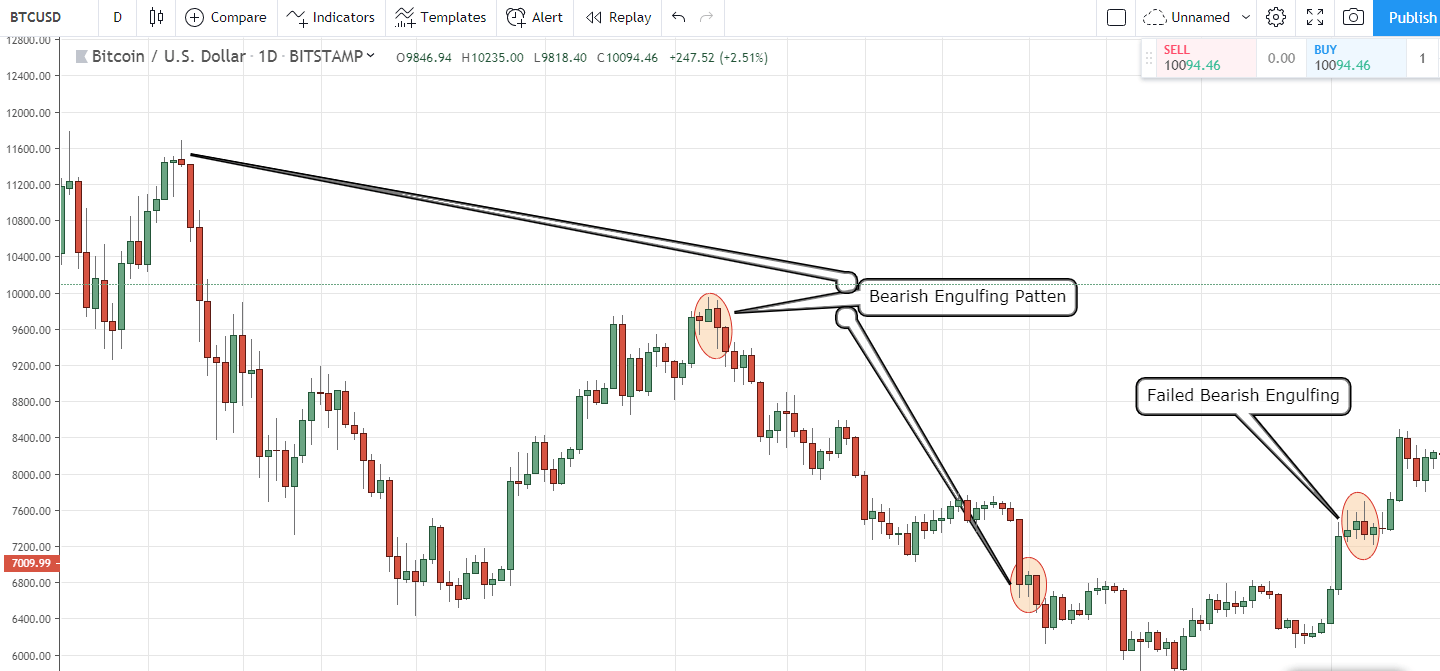
The bearish engulfing candle is a common occurrence in forex or Crypto charts. They work best in longer time frames and are easy to spot. However, traders use this pattern along with other oscillators to have a more precise picture of the market situation. Below is an image of Bitcoin to Dollar chart depicting how bearish engulfing pattern leads to a price reversal.
You can also analyze from the above chart that failure of reversal is also a norm in this formation which is why many traders use oscillators and other indicators before opening a short position.
Bearish engulfing candlestick Limitations
Unlike the Moving Average signal, one candlestick only gives a small picture of market sentiment for a certain time. Engulfing patterns cannot predict the long-term market movement of the price. Thus, the pattern is largely useful for day trading or people who are beginning their trading career.
The pattern has a higher success rate if the bearish engulfing candle is below the open price of the previous candle. The lower price of a bearish candle show increase selling pressure and imminent market downtrend. One thing to note here is that the engulfing candle indicator might form during sideways but will unlikely to result in any major price movement.
Overall, establishing a successful position might be difficult using the bearish engulfing candle and also result in losses. The formation also doesn’t provide any price target which adds to more frustration for many traders.
In Conclusion
The Bearish engulfing candle might be a great reversal pattern if you use it with Moving Average or any other oscillator. It works best in a longer time frame but is also good for day trading or to make some quick profits by going for a short call. However, the pattern only provides a short-term picture of the overall market which can cause losses for traders setting up a long-term position based on the pattern.


